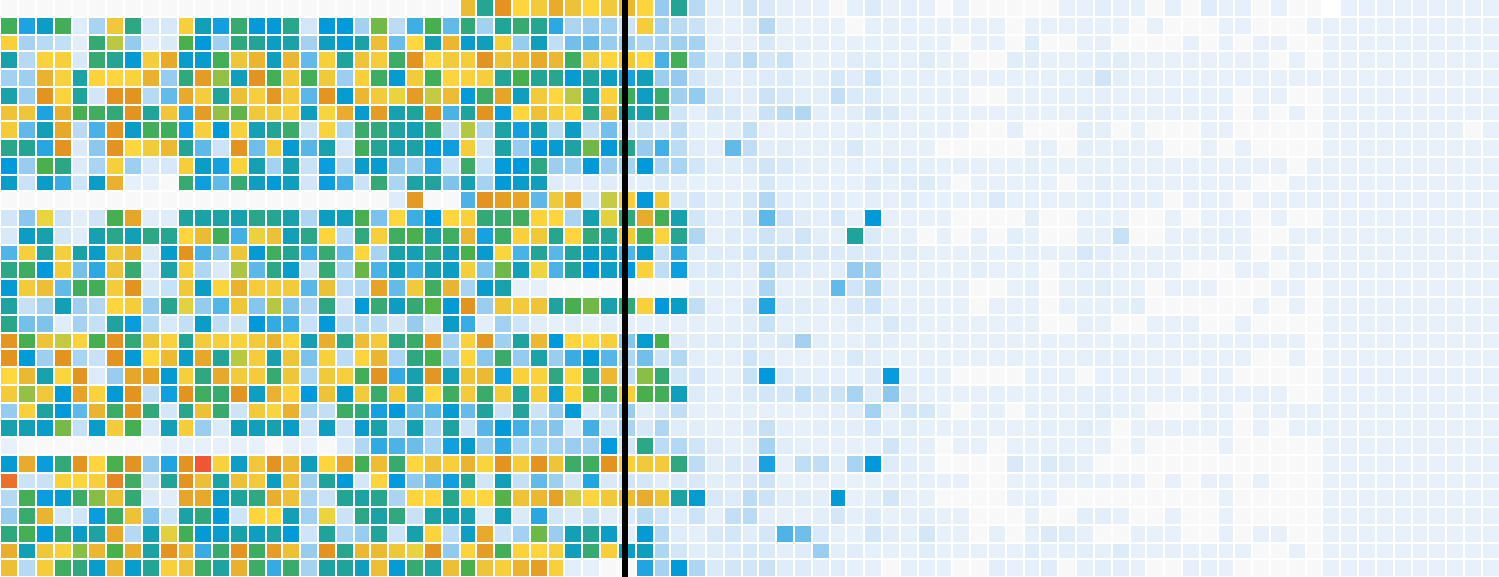
The Impact of Vaccines

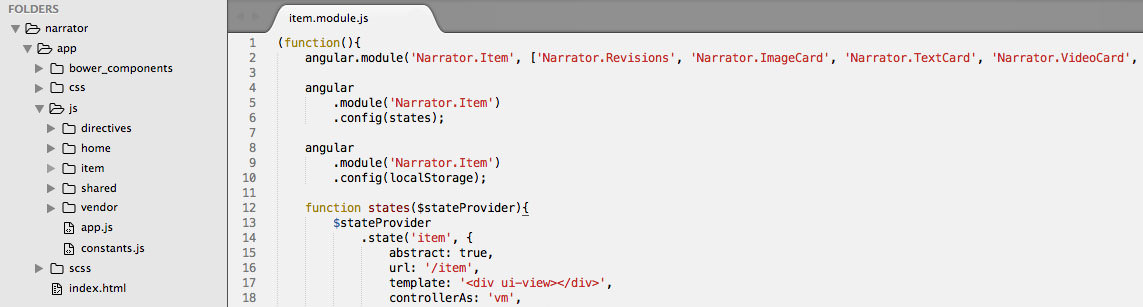
Winner of GEN Data Visualisation of the Year 2015. This project documents the impact vaccines had on 7 infectious diseases. We used Excel to aggregate over 100,000 data points. The data was then plotted on heatmaps using Highcharts. All sections were templatized with handlebars.

View project

World Water and Sanitation, 25 Years Later

An exploration of the world's water and sanitation using d3 and topojson. This interactive utilizes country lookups, categorical dropdowns and radio buttons to tell a story about how the world has progressed over the past 25 years.

View project

movabletype.com

While at Code and Theory I lead the development of a new consumer site, movabletype.com. Features of the site included Stripe's API for secure payments, Swift Mailer. Other tech used: PHP, Video.js, GreenSock, Processing.js, Compass, custom font icons


Cloud Document Creation Store

An enterprise level cloud document creation application. This application was build on top of Node.js, Express and Mongodb. It allowed administrators to quickly create analytical reports on companies and share them with clients. Other tech used: Passport.js, Knockout, Compass, Grunt, Handlebars, custom font icons


California's Long Challenge With Drought

A large scale project that maps drought stricken California with a focus on precipition, reservoir levels and temperatures. I wrote a bash script that ingests shape files into a PostgreSQL/PostGIS database. The db was then queried for specific geo regions and exported as GeoJSON to be visualized using d3. Other tech used: topojson, shp2pgsql

View project

WSJ.com Templates

Managed and implemented the rebuild of wsj.com's core interactive templates. Some of these include quizzes, photo annotations, carousels, galleries and sortable tables. These templates have become essential visual story telling tools.

Embeddable Carousel

Photo Annotation

Gallery

Locator Map

Quiz


WSJ: Editorial Tools

Optimized global production workflow with a centralized suite of modular tools. The dashboard provides easy access and education around each tool. It's the one stop shop for brand immersion, content creation and production. Robust APIs allow other developers to extend the tools.


Markets & Finance Year in Charts

A charticle mapping 2014's financial fluctuations of 4 sectors. Financial data was aggregated and pass through a handlebars template parser and displayed via Highcharts. Other tech used: Custom Icon Fonts

View project

ioanafriedman.com

A portfolio site for an NYC Digital Creative Directer. Powered by Wordpress, I built a mobile first user experience that used swipe pagination and fully responsive design. Other tech used: Grunt, Wordpress custom theme, Post Types and Fields

View project

edificearchitectural.com

A one pager for a Washington D.C. Architecture firm. This responsive, mobile first site is powered by Wordpress and utilizes a grunt build and deployment process. Other tech used: Wordpress custom theme, Post Types and Fields

View project

bentyree.net

A branding and news site for a NYC based musician. This site is built on top of Wordpress and features slideshows, an html5 audio player, SoundCloud integration and calendar of events. Other tech used: Wordpress custom theme, post types and fields

View project